Agri Business: Paper,Pulp,Timber,Wood app for iPhone and iPad
Developer: Sand Apps Inc.
First release : 18 Jul 2011
App size: 51.59 Mb
Thousands of data points, charted into easy to understand visuals. You can trend, track and compare farm trade, production and usage.
Tools:
======
Compare unlimited countries over time by simply clicking their flags
6 different chart types
3D options for Pie charts
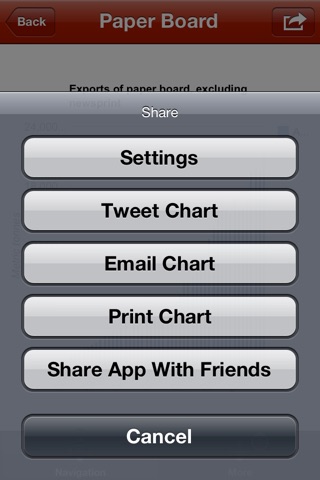
Export your custom charts for use in other projects
Email charts
Rotate and render
Reports Groups:
===============
"Exports of paper board, excluding newsprint"
"Exports of paper board, excluding newsprint (nes)"
"Exports of paper and paperboard"
"Exports of Newsprint"
"Exports of Printing and Writing Paper"
"Exports of Recovered Paper"
"Exports of Wrapping Paper"
"Exports of Bleached Sulphate Pulp"
"Exports of Wrapping Packaging and Paperboard"
"Exports of Chemical Wood Pulp"
"Exports of Dissolving Wood Pulp"
"Exports of Wood Pulp"
"Exports of Pulp for Paper"
"Exports of Mechanical Wood Pulp"
"Exports of Recovered Fibre Pulp"
"Exports of Fibreboard"
"Exports of Compressed Fibreboard"
"Exports of Particle Board"
"Exports of Plywood"
"Exports of Wood Based Panels"
"Exports of Case Materials"
"Exports of Industrial Roundwood"
"Exports of Roundwood"
"Exports of Wood Chips and Particles"
"Exports of Forest Products"
"Exports of Wood Fuel"
Countries:
==========
All major/mid-range players
Source:
=======
Data provided by member nations to the United Nations.
Requires an active network.


